
303 of 412 highly AI-exposed occupations are still projected to grow
AI exposure is not a job-loss verdict.
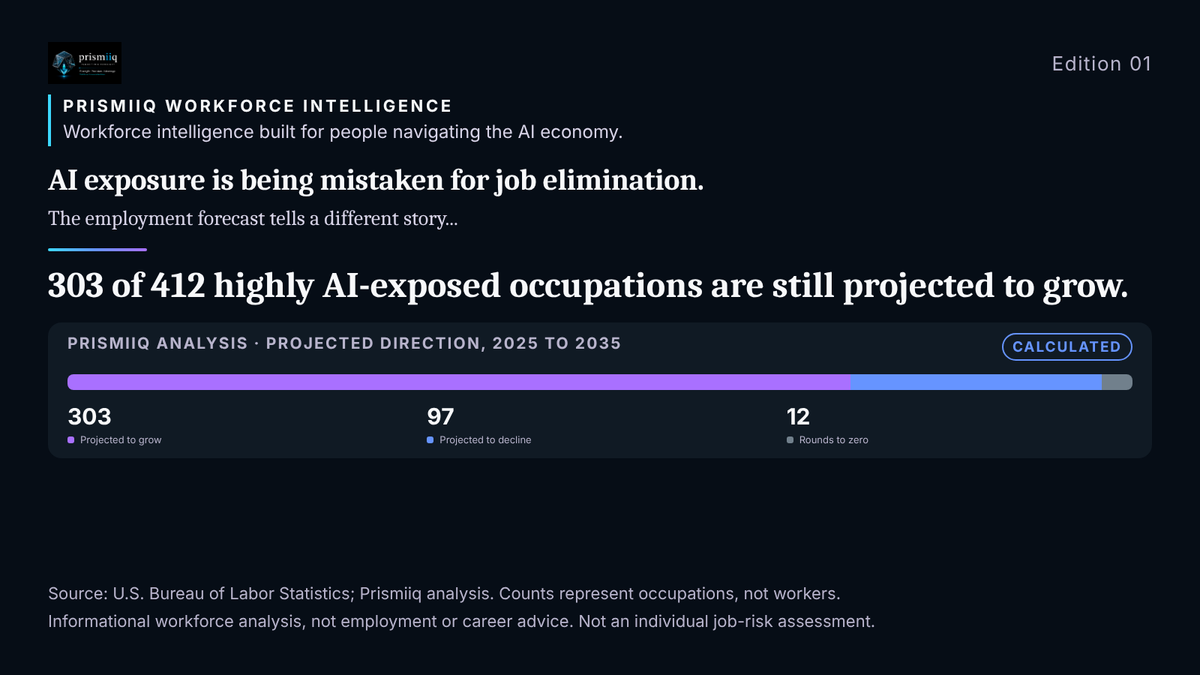
AI exposure is being mistaken for job elimination.
The employment forecast tells a different story...
303 of 412 highly AI-exposed occupations are still projected to grow.
To pressure-test that assumption, Prismiiq connected AI-exposure classifications with 2025 to 2035 employment projections.
The takeaway: exposure does not dictate demand. Projected demand diverges across occupations, and even for the same work in different industries.
303 Projected to grow | 97 Projected to decline | 12 Rounds to zero |
The decision-relevant signal
Workers should not ask only, “How exposed is my job to AI?” They should also ask, “Is demand for my occupation rising or falling in my industry, and where is the same work growing?” The answer can reveal where to build skills, seek opportunities or prepare for transition.
Why Prismiiq built this
Prismiiq’s mission is not just to forecast the future, but to build the algorithms that protect it. Workforce Intelligence brings that mission to workers. We believe people deserve clear evidence about the forces reshaping their work, with enough visibility and time to make informed choices.
Workers should not be the last to see change coming.
Laura Becerra, Founder and CEO, Prismiiq
What changed
- Reported On 27 August 2026 BLS published its 2025 to 2035 employment projections together with, for the first time, a Relative AI Exposure category for every occupation.
- Calculated Prismiiq archived both releases and joined them by occupation code for all 831 occupations, then read them by industry.
1 · The evidence-based reassurance
High AI exposure is not the same as falling demand.
Calculated Of the 412 occupations BLS rates High or Very high for Relative AI Exposure, 303 are projected to grow (73.5%).
2 · The tension
- Calculated 97 highly exposed occupations are projected to decline and 12 round to zero.
| Software developers | +10.2% |
| 1,717,800 jobs in 2025, national | |
| Office clerks, general | −6.0% |
| 2,600,000 jobs in 2025, national | |
- Calculated The most exposed industry shown, aerospace manufacturing (61.7% of published jobs highly exposed), grows fastest (+10.1%); parts manufacturing (31.4%) has the weakest outlook (−13.9%).
- Reported These count occupational titles, not workers, and BLS states exposure is not a forecast of job loss.
3 · Why context matters
Vehicle assembly grows while the parts workforce contracts.
Calculated Inside one industry family, BLS projects motor vehicle manufacturing at +7.1% and motor vehicle parts manufacturing at −13.9%: a 21.0-point gap.
| Motor vehicle manufacturing | +7.1% |
| 285,800 jobs in 2025 | |
| Motor vehicle parts manufacturing | −13.9% |
| 524,700 jobs in 2025 | |
- Reported Motor vehicle parts manufacturing: 524,700 jobs in 2025, 73,200 fewer projected by 2035.
| In motor vehicle manufacturing | +6.9% |
| 151,300 jobs in 2025 | |
| In motor vehicle parts manufacturing | −12.9% |
| 126,000 jobs in 2025 | |
Calculated Of the 119 occupations BLS publishes in both industries, 30 move in opposite directions between them.
Aviation grows, but not every aviation job grows with it.
Reported Every aviation-related industry shown is projected to grow, yet inside aerospace manufacturing (+10.1%), aircraft structure, surfaces, rigging, and systems assemblers are projected at −5.8%.
| Scheduled air transportation | +6.4% |
| 512,100 jobs in 2025 | |
| Support activities for air transportation | +6.1% |
| 270,200 jobs in 2025 | |
| Nonscheduled air transportation | +4.4% |
| 58,000 jobs in 2025 | |
| Aerospace product and parts manufacturing | +10.1% |
| 568,100 jobs in 2025 | |
- Reported Aircraft mechanics and service technicians grow in every aviation industry shown, from +3.9% to +10.8%.
- Reported Aerospace manufacturing combines commercial and defense work; BLS does not separate them.
| Aerospace engineers | +10.8% |
| 26,100 jobs in 2025 | |
| Aircraft mechanics and service technicians | +10.8% |
| 25,100 jobs in 2025 | |
| Aircraft structure, surfaces, rigging, and systems assemblers | −5.8% |
| 31,100 jobs in 2025 | |
Calculated A growing industry does not mean every occupation in it grows.
4 · What Prismiiq adds
AI exposure alone is insufficient. Industry demand, current hiring, observed adoption, company pressure, workforce events and transition capacity must also be examined.
BLS reports occupations and industries. Prismiiq joins them and is building the remaining layers. Layers marked Unavailable are not in this edition, and nothing stands in for them.
Prismiiq calculations in this edition
- Calculated Of the 412 occupations BLS rates High or Very high for Relative AI Exposure, 303 are projected to grow (73.5%).How: 303 ÷ 412 = 73.5% of occupations.
- Calculated 97 highly exposed occupations are projected to decline and 12 round to zero.How: Count by sign of projected change among High and Very high occupations
- Calculated The most exposed industry shown, aerospace manufacturing (61.7% of published jobs highly exposed), grows fastest (+10.1%); parts manufacturing (31.4%) has the weakest outlook (−13.9%).How: Jobs in High or Very high occupations ÷ published detailed jobs, by industry
- Calculated Inside one industry family, BLS projects motor vehicle manufacturing at +7.1% and motor vehicle parts manufacturing at −13.9%: a 21.0-point gap.How: +7.1% − (−13.9%) = 21.0 points
- Calculated The parts decline of 73,200 jobs is larger than the 47,600 net decline across all three automotive industries combined.How: Sum of projected change in vehicle manufacturing, body and trailer manufacturing and parts manufacturing = −47,600 jobs
- Calculated Of the 119 occupations BLS publishes in both industries, 30 move in opposite directions between them.How: Count of occupations with published cells in vehicle manufacturing and parts manufacturing whose projected change differs in sign
- Calculated In scheduled air transportation, 58 of 93 published occupations carry a shared +3.9%, below the industry's +6.4%; flight attendants and pilots, at +9.1%, carry more of the growth.How: Occupations sharing the most common projected change in scheduled air transportation, compared with the industry total
- Calculated A growing industry does not mean every occupation in it grows.How: Occupation cells in aerospace manufacturing compared with the industry total
5 · What this means for workers
- Calculated Your industry can matter as much as your title: miscellaneous assemblers and fabricators are projected at +6.9% in vehicle plants and −12.9% in parts plants.
- Calculated Growth in your industry is not growth in your job: aircraft structure, surfaces, rigging, and systems assemblers decline while aerospace grows.
- Calculated An AI-exposure rating on its own does not tell you whether demand for your work is rising.
- Look up your industry, not only your job title, and check whether your occupation follows that industry's outlook or departs from it.
- If you work in parts manufacturing, compare your occupation across the vehicle, body and parts industries.
- Read an AI-exposure rating next to the projected demand for your occupation, never on its own.
- Use this as ten-year context for planning. Current openings, wages and skills transfer are not yet in this evidence.
- Unavailable Which occupations a worker's skills transfer to, and which transitions are realistic.
6 · What Prismiiq monitors next
Evidence Prismiiq is adding. None of it is in this edition yet.
- Current hiring and separations in transportation-equipment manufacturing and air transportation.
- WARN notices and plant actions among parts manufacturers.
- Financial pressure disclosed in SEC filings by companies in these sectors, joined to their workforce outlook.
- Observed AI adoption by employers in these industries.
- The next annual BLS projections: does the parts outlook stay negative?
Counterevidence
- Reported Body and trailer manufacturing, also automotive, is projected to grow +3.5%.
- Reported Some parts occupations hold up better than their industry's −13.9%: industrial engineers −5.1%; industrial machinery mechanics +4.5%; mechanical engineers −6.0%.
- Calculated Most occupations in an industry repeat its projection (95 of 181 in parts at −12.9%). They are not independent confirmation of it.
- Calculated Eight industries are a comparison, not a statistical relationship between exposure and growth.
What is not established
- Unavailable Why the vehicle and parts industries diverge.
- Unavailable Whether AI contributes to any projected change.
- Unavailable Which employers, plants or workers are affected, or when.
- Hypothesis Sourcing shifts, supplier consolidation or vehicle-platform changes could contribute to the parts outlook. Prismiiq has not tested this.
- Hypothesis Aviation growth may reflect passenger demand, fleet renewal or defense spending. Prismiiq has not tested this.
What employers could do to reduce disruption
Options with their operating and financial logic. Prismiiq has not established that any of them prevents a reduction.
- How it works
- Matching displaced roles to open roles with shared skills.
- Financial logic
- Keeps trained workers; avoids severance and rehiring cost.
- Cost
- Transition training and productivity dip.
- Working if
- Share of affected workers placed in open roles within two quarters.
- How it works
- Approval gates on new requisitions by role.
- Financial logic
- Avoids adding cost in roles with falling demand.
- Cost
- Unfilled-demand risk.
- Working if
- Requisitions fall in targeted roles; critical roles stay filled.
- How it works
- Training mapped to the destination role's skills.
- Financial logic
- Training cost against severance, rehiring and productivity loss.
- Cost
- Training and paid training time.
- Working if
- Completers placed in the destination role and retained after twelve months.
- How it works
- Sequence changes with redeployment and attrition first.
- Financial logic
- Spreads separation cost and preserves capacity during transition.
- Cost
- Transition cost; longer timeline.
- Working if
- Involuntary separations below the initial plan; capacity maintained.
Explore evidence-led workforce intelligence for people navigating the AI economy.
Explore Workforce Intelligence →Sources and publication dates
- BLS National Employment Matrix, 2025 to 2035U.S. Bureau of Labor Statistics. Published 27 August 2026; retrieved by Prismiiq 14 October 2026. Employment by industry and occupation, 2025 and projected 2035; thousands of jobs, rounded.
- BLS AI exposure categories and 2025 to 2035 projectionsU.S. Bureau of Labor Statistics. Published 27 August 2026; retrieved by Prismiiq 10 October 2026. Relative AI Exposure for 831 occupations. Relative ranking; not a forecast of employment or job loss.
- BLS occupational projections data and methodsU.S. Bureau of Labor Statistics. Published 27 August 2026. Definitions, units and methods.
BLS figures are rounded to the nearest hundred jobs. Calculations are Prismiiq's, not BLS's; BLS.gov cannot vouch for the data or analyses derived from these data after the data have been retrieved from BLS.gov.
Evidence base: Prismiiq connected and analyzed two federal datasets: 2025 to 2035 employment projections and Relative AI Exposure classifications. Source: U.S. Bureau of Labor Statistics, published August 27, 2026. Prismiiq calculated the occupation counts and cross-industry comparisons. “Highly AI-exposed” includes occupations rated High or Very high. Counts represent occupations, not workers; exposure is not a forecast of individual job loss.
Prismiiq Workforce Intelligence provides informational analysis, not employment, legal, investment, or individualized career advice. Workforce and AI-exposure indicators describe patterns in available data; they do not establish that layoffs will occur or that any individual’s job is at risk.